Greater Phoenix
Real Estate
Brian Adamski, Realtor
17+ Years of Experience
Honesty. Trustworthy. Integrity.
Greater Phoenix Market Overview
Highlights
As of March 16, 2025, the single-family home market in Metro Phoenix reflects a diverse and evolving landscape of opportunities for both buyers and sellers.
- Over the past month, active listings have expanded to 23,083, significantly surpassing the 17,184 from three months ago, indicating a robust supply.
- Meanwhile, the average sold price for homes has climbed to $704,884, demonstrating ongoing demand despite the increased inventory.
Market Snapshot as of 3.16.2025 | Inventory and Pricing |
---|---|
Active Listings: | 16,831 |
Avg Price: | $926,233 |
Avg Days on Market: | 78 |
Avg Price per Sqft: | $321 |
Months of Inventory: | 5.5 |
Sold Listings (last mo): | 4,836 |
Avg Price: | $704,884 |
Avg Days on Market: | 62 |
Avg Price per Sqft: | $297 |
Sold Listings (last 3 mos): | 12,524 |
Avg Price: | $684,930 |
Avg Days on Market: | 63 |
Avg Price per Sqft: | $293 |
Highlights
As of March 16, 2025, the condos/townhomes market in Greater Phoenix displays interesting shifts that could influence buyer and seller strategy.
- Over the past month, the number of active listings has surged to 4,996, reflecting higher inventory levels compared to recent months.
- The average sold price rose to $459,964 over the last month, up from $425,278 three months ago, indicating increased buyer demand.
- Days on the market (DOM) have now climbed to an average of 83 days, suggesting that while competition has increased, buyers may need to be more strategic with their offers.
Market Snapshot as of 3.16.2025 | Inventory and Pricing |
---|---|
Active Listings: | 3,891 |
Avg Price: | $507,006 |
Avg Days on Market: | 83 |
Avg Price per Sqft: | $340 |
Months of Inventory: | 6.6 |
Sold Listings (last mo): | 835 |
Avg Price: | $459,964 |
Avg Days on Market: | 69 |
Avg Price per Sqft: | $316 |
Sold Listings (last 3 mos): | 2,272 |
Avg Price: | $484,514 |
Avg Days on Market: | 66 |
Avg Price per Sqft: | $324 |
Highlights
As of March 16, 2025, the land market in Greater Phoenix reflects a complex landscape influenced by several interrelated metrics.
- Active listings currently total 3,911, showing a significant increase over the past month.
- The average price per square foot has slightly fluctuated but remains within a stable range.
- Days on Market (DOM) has extended, indicating homes are taking longer to sell than in previous periods.
- Inventory levels have adjusted, with months of inventory currently at 16.0, signaling a softer demand and a buyer's market.
Market Snapshot as of 3.16.2025 | Inventory and Pricing |
---|---|
Active Listings: | 3,562 |
Avg Price: | $621,266 |
Avg Days on Market: | 287 |
Avg Price per Sqft: | $8 |
Months of Inventory: | 16.0 |
Sold Listings (last mo): | 254 |
Avg Price: | $320,396 |
Avg Days on Market: | 181 |
Avg Price per Sqft: | $8 |
Sold Listings (last 3 mos): | 733 |
Avg Price: | $331,153 |
Avg Days on Market: | 175 |
Avg Price per Sqft: | $8 |
Highlights
As of March 16, 2025, the multifamily market in Greater Phoenix is experiencing notable shifts that may impact both buyers and sellers.
- Inventory levels have shown an increase, currently standing at 334 active listings, a rise from 243 listings three months ago.
- Additionally, the average Days on Market (DOM) for active listings is presently 121 days, compared to 143 days three months prior, indicating a reduced time to sell.
- Furthermore, the average sold price has seen growth, climbing to $652,454 over the last month, up from $636,333 three months ago.
Market Snapshot as of 3.16.2025 | Inventory and Pricing |
---|---|
Active Listings: | 276 |
Avg Price: | $1,352,790 |
Avg Days on Market: | 121 |
Avg Price per Sqft: | $323 |
Months of Inventory: | 9.3 |
Sold Listings (last mo): | 46 |
Avg Price: | $652,454 |
Avg Days on Market: | 67 |
Avg Price per Sqft: | $252 |
Sold Listings (last 3 mos): | 108 |
Avg Price: | $694,818 |
Avg Days on Market: | 69 |
Avg Price per Sqft: | $288 |
Info About Greater Phoenix
The Greater Phoenix area is 10th largest metro area in the United States (4,652,000 people).
Two major airports serve Greater Phoenix. Phoenix Sky Harbor International Airport is the main one and is considered the 10th busiest in the United States. In 2004, Phoenix-Mesa Gateway Airport started commercial passenger flights.
Phoenix is in the northeastern part of the Sonoran Desert at about a mean elevation of 1,117 feet (340 m) and has a subtropical desert climate.
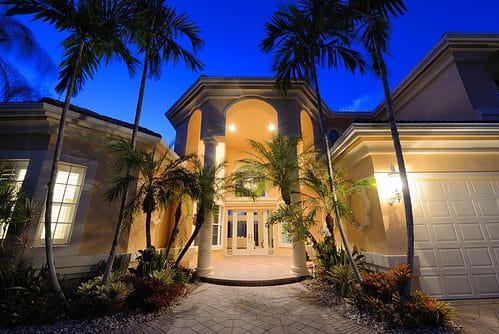
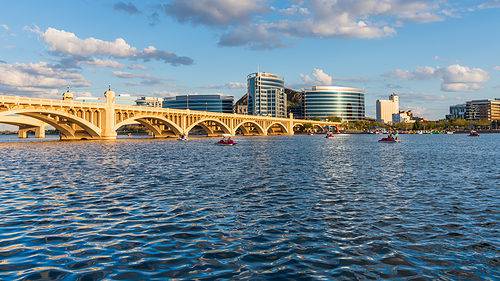
High Demand
For the last decade or so, Greater Phoenix real estate has been in the top 3 metro areas for people wanting to buy for both their primary home, secondary homes, and investment purposes. Since, COVID, the demand for Phoenix, AZ real estate has increased even more.
Read More......Read Less
Weather
Phoenix is frequently referred to as the Valley of the Sun and for good reason, as you can expect to see the sun, on average, 85% throughout the year. 8-9 months out of the year the weather in Phoenix is glorious and is one big reason people move here. Winter months are warm, with daily high temperatures ranging from the mid-50s to high 70s and low temperatures mostly in the low 40s, occasionally dipping below 40. On average, Phoenix has only five days per year where the temperature drops to or below freezing. The summer high average temperatures are typically over 100 °F (38 °C).
Economy
Eight Fortune 500 firms are currently headquartered here: Freeport-McMoRan, Avnet, Carvana, Republic Services, Insight Enterprises, Opendoor Technologies, Taylor Morrison Homes, and ON Semiconductor.
Phoenix has plenty of high-tech and telecommunications companies like Intel, GoDaddy, LifeLock, Gainsight, Microchip, Keap, Honeywell’s Aerospace division, and countless more.
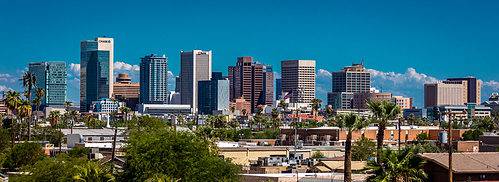
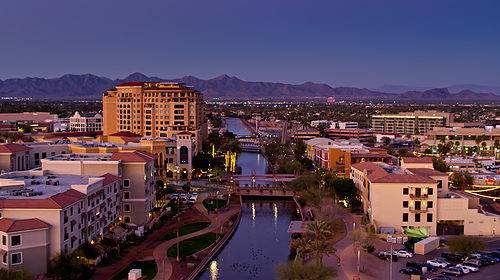
Phoenix also benefits from tourism and recreation because of its weather and proximity to places like the Grand Canyon. Several golf events occur throughout the Phoenix Metro area, including the PGA’s Waste Management Phoenix Open.
Culture
Some of the best museums, theatres, and art galleries in the Southwest are located here.
Things To Do
Enjoy the outdoors year round! There is great hiking, mountain biking, and horseback riding on the many different mountain ranges throughout Greater Phoenix.
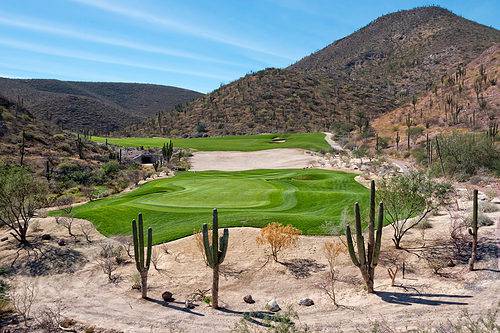
Phoenix is one the world’s golf capital and has many interesting, challenging, and unique courses.
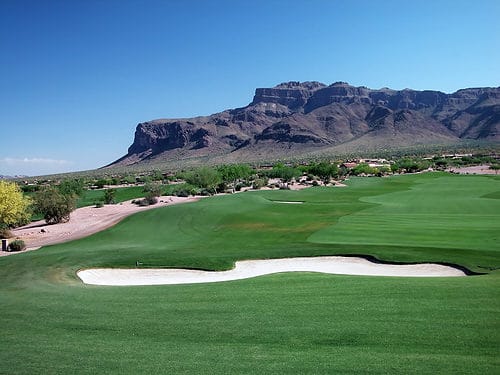
Need to cool off? Phoenix has plenty of water parks or go tubing on the Salt River.
Phoenix also has plenty of public parks to relax with the family, have a picnic, swim in the pool, tennis, pickleball, or volleyball.
Within a 2-6 hour car drive lies the Grand Canyon, Sedona, Tucson, San Diego, Las Vegas, Palm Springs, Los Angeles, or even Mexico.
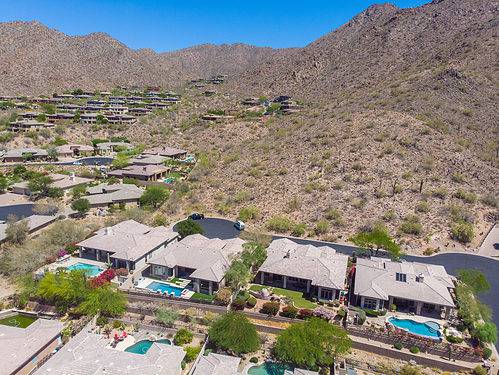
Topography
Generally speaking, the Greater Phoenix is flat, but mountain ranges are in and around the valley. If you’re looking for mountain views and foothills to break up the flatness, I would look at areas such as Ahwatukee (south), Biltmore Area (central), Arcadia Area (central), North Scottsdale (north), and Gold Canyon (east).
Want Help to Buy or Sell from an Expert?
If you’re looking for an experienced Greater Phoenix real estate agent, then you found one here! Brian is ranked in the top 3% in AZ. Whether you are looing for a single family home, a condo, or land, he is your guy!
Featured Cities in Greater Phoenix
Greater Phoenix Real Estate for Sale
Be the First to See New Listings
No pressure. Unsubscribe anytime. I hate spam too, so you can trust that I'll safeguard your information.
Greater Phoenix Market Report
Current as of 3.16.2025 | Listings | Avg Price | Price per Sqft | Days on Market | Low Price | High Price | order_column |
---|---|---|---|---|---|---|---|
Active | 16,831 | 926,233 | 321 | 78 | 1 | 30,000,000 | 1 |
Under Contract | 7,039 | 725,400 | 298 | 69 | 125,000 | 42,500,000 | 2 |
Coming Soon | 727 | 1,014,840 | 347 | 0 | 230,000 | 50,000,000 | 3 |
Sold as of 3.16.2025 | Listings | Avg Price | YoY | Price per Sqft | Days on Market | Sold Price to List Price | Sold Price to Orig List Price | Low Price | High Price |
---|---|---|---|---|---|---|---|---|---|
Last 3 mos | 12,524 | 684,929 | 0.0 | 293 | 62 | 98 | 96 | 35,000 | 21,000,000 |
Last 6 mos | 25,479 | 662,861 | 0.0 | 287 | 59 | 98 | 96 | 35,000 | 21,000,000 |
Last 12 mos | 54,583 | 655,939 | 0.0 | 285 | 55 | 98 | 96 | 20,000 | 32,388,888 |
2025 | 10,159 | 698,570 | 8.6 | 296 | 63 | 98 | 96 | 35,000 | 21,000,000 |
2024 | 54,460 | 643,160 | 5.1 | 283 | 54 | 98 | 96 | 20,000 | 32,388,888 |
2023 | 54,406 | 611,924 | -1.4 | 272 | 56 | 98 | 96 | 25,000 | 23,500,000 |
2022 | 64,690 | 620,397 | 13.7 | 290 | 30 | 100 | 98 | 24,900 | 28,100,000 |
2021 | 83,942 | 545,662 | 28.1 | 247 | 21 | 102 | 101 | 15,000 | 21,500,000 |
An In-Depth Look at Greater Phoenix Houses
The current dynamics of the Metro Phoenix single-family home market reveal several interesting trends that merit further analysis.
- Active Listings: There are currently 23,083 active listings, which shows a marked increase from 17,184 active listings three months ago and 14,896 six months ago. This expansion indicates a thriving market likely driven by both new listings and existing homes becoming available for sale as sellers take advantage of current prices.
- Days on Market (DOM): The average DOM for active listings is currently 78 days. While this is higher than the 60 days recorded three months ago, it presents a manageable timeline that suggests sellers are adjusting their strategies to remain competitive amidst growing inventory.
- Months of Inventory: The months of inventory has reached 5.5, a noticeable increase from 4.1 three months ago. This uptick suggests a slight slowdown in the pace at which homes are selling, which could give buyers more negotiating power.
- Sold Prices: The average sold price has impressively risen to $704,884 in the last month, up from $672,630 three months ago. This substantial growth highlights that, despite the increased availability of homes, buyer demand continues to drive prices upward, indicating a strong market appetite.
- Price Per Square Foot: The average price per square foot for homes sold in the past month stands at $297, showcasing the continuing demand amid rising inventory levels.
- Overall, the current market conditions may favor buyers slightly due to the increase in months of inventory. However, strong buyer interest reflected in the rising sold prices suggests a competitive landscape as homes still sell for close to their asking price, affirmed by the average sold price to original list price percentage remaining consistent at 96%.
In summary, while the current influx of inventory offers a broader array of choices for buyers, it also reinforces the need for all market participants to stay informed. Both buyers and sellers can benefit from understanding these nuanced dynamics, enabling them to make more strategic decisions tailored to the current conditions in the Metro Phoenix market.
Current as of 3.16.2025 | Listings | Avg Price | Price per Sqft | Days on Market | Low Price | High Price | order_column |
---|---|---|---|---|---|---|---|
Active | 3,891 | 507,006 | 340 | 83 | 1 | 12,900,000 | 1 |
Under Contract | 1,259 | 677,332 | 378 | 76 | 69,000 | 8,350,000 | 2 |
Coming Soon | 120 | 560,785 | 378 | 0 | 175,000 | 4,480,000 | 3 |
Sold as of 3.16.2025 | Listings | Avg Price | YoY | Price per Sqft | Days on Market | Sold Price to List Price | Sold Price to Orig List Price | Low Price | High Price |
---|---|---|---|---|---|---|---|---|---|
Last 3 mos | 2,272 | 484,513 | 0.0 | 324 | 65 | 97 | 95 | 61,000 | 5,467,543 |
Last 6 mos | 4,407 | 444,569 | 0.0 | 329 | 61 | 97 | 95 | 50,000 | 5,467,543 |
Last 12 mos | 9,607 | 426,710 | 0.0 | 336 | 56 | 97 | 95 | 39,000 | 5,467,543 |
2025 | 1,899 | 492,552 | 18.5 | 327 | 67 | 98 | 95 | 61,000 | 5,467,543 |
2024 | 9,566 | 415,489 | 2.5 | 350 | 53 | 98 | 96 | 39,000 | 4,500,000 |
2023 | 10,291 | 405,205 | 1.3 | 297 | 49 | 98 | 96 | 35,000 | 5,500,000 |
2022 | 12,782 | 399,864 | 18.8 | 323 | 26 | 100 | 99 | 40,000 | 6,000,000 |
2021 | 17,568 | 336,627 | 23.1 | 252 | 23 | 101 | 100 | 37,000 | 4,200,000 |
An In-Depth Look at Greater Phoenix Condos
The Greater Phoenix area is currently experiencing notable real estate dynamics in the condos/townhomes market. Over the past month, active listings have climbed significantly to 4,996, which marks a sharp increase from just 3,579 active listings three months ago. This rise in inventory suggests a growing selection for buyers, which could balance out the previous competitive pressures felt within the market.
As for the average sold prices, they have seen an increase to $459,964 recently, up from $425,278 three months prior. This upward trend may indicate both increasing buyer confidence and willingness to secure properties at competitive prices amid the expanding inventory.
However, while sold prices have risen, the DOM has also increased to 83 days, which is notably higher than 60 days from three months ago. This uptick in DOM indicates that homes are staying on the market longer, possibly reflecting a hesitation among buyers in the current pricing environment, or suggesting that pricing strategies are beginning to adjust in response to the higher inventory levels.
Furthermore, the months of inventory have reached 6.6, indicating a shift towards what could be seen as a more balanced market, as this number is higher than the desirable seller's market threshold of 4 months. In comparison, the inventory level was significantly lower at 5.2 months three months ago, suggesting that the current supply is outpacing demand, placing buyers in a more advantageous position during negotiations.
In addition, not only has the increase in active listings provided more choices for buyers, but the relationship between list prices and pending transactions may also provide insight. Currently, the average price per square foot for active listings is $340, compared to $378 for pending listings, indicating that homes under contract are typically priced higher, hinting at some negotiating activity that favors sellers.
Buyers may want to take note of these trends as calculating their offers with these current market conditions in mind could ultimately help them in navigating this evolving market landscape. Conversely, sellers should consider reviewing their pricing strategies, as homes are experiencing longer stays in the market. Overall, a strategic approach will be essential for both buyers and sellers in the Greater Phoenix area as market conditions continue to evolve.
Current as of 3.16.2025 | Listings | Avg Price | Price per Acre | Price per Sqft | Days on Market | Low Price | High Price | order_column |
---|---|---|---|---|---|---|---|---|
Active | 3,562 | 621,266 | 356,278 | 8 | 287 | 1 | 82,373,800 | 1 |
Under Contract | 379 | 728,944 | 468,741 | 11 | 261 | 1 | 16,000,000 | 2 |
Coming Soon | 5 | 1,005,800 | 895,454 | 21 | 0 | 59,000 | 3,250,000 | 3 |
Sold as of 3.16.2025 | Listings | Average Price | YoY | Price per Sqft | Price per Acre | Days on Market | Sold Price to List Price | Sold Price to Orig List Price | Low Price | High Price |
---|---|---|---|---|---|---|---|---|---|---|
Last 3 mos | 733 | 331,153.0 | 0.0 | 7 | 347,545 | 175 | 91 | 86 | 4,000 | 13,972,582 |
Last 6 mos | 1,375 | 320,762.2 | 0.0 | 8 | 349,378 | 164 | 91 | 87 | 3,500 | 13,972,582 |
Last 12 mos | 3,091 | 300,047.7 | 0.0 | 7 | 338,394 | 154 | 91 | 87 | 1 | 42,000,000 |
2025 | 588 | 323,589.0 | 4.8 | 8 | 346,506 | 191 | 91 | 87 | 4,000 | 7,900,000 |
2024 | 3,242 | 283,572.0 | 14.8 | 8 | 330,745 | 145 | 92 | 88 | 1 | 42,000,000 |
2023 | 3,388 | 245,242.0 | -5.2 | 7 | 288,005 | 137 | 90 | 85 | 100 | 11,860,582 |
2022 | 4,535 | 236,864.0 | 24.4 | 7 | 303,712 | 112 | 93 | 91 | 1,265 | 33,957,000 |
2021 | 6,441 | 223,794.0 | 9.1 | 6 | 244,134 | 158 | 94 | 92 | 1 | 20,000,000 |
An In-Depth Look at Greater Phoenix Land
The Greater Phoenix land market has experienced notable shifts, as highlighted in the recent metrics. Currently, we have 3,911 active listings, a clear increase from the 3,554 listings recorded three months ago. This uptick in active listings corresponds with an increase in months of inventory, which currently stands at 16.0, up from 12.0 six months ago. Such high months of inventory indicates a market trend leaning towards buyers, suggesting a surplus of listings compared to demand.
Furthermore, the average days on market (DOM) has risen significantly, reaching 287 days compared to 317 days three months prior. This increase in DOM signifies that properties are taking longer to sell, reflecting buyer hesitation or perhaps an increase in listings surpassing buyer purchasing power.
In terms of pricing, while the average price per square foot has remained fairly consistent, hovering around $8, analysis of the sold prices reveals that the market dynamics are indeed fluctuating. Sold listings averaged $320,396 over the last 30 days, slightly up from $341,246 three months ago. This drop in average sold prices, combined with the rise in DOM and inventory, suggests a market in transition, where sellers may need to adjust their price expectations and strategies.
In conclusion, the Greater Phoenix land market is currently characterized by an increase in listings and inventory, extended selling times, and a softening in sold prices. Potential buyers have the advantage right now, as sellers must navigate this competitive landscape where homes are staying on the market longer. Adjusting their pricing strategies will be essential for sellers aiming to remain attractive to buyers in a market increasingly favoring them.
Current as of 3.16.2025 | Listings | Avg Price | Price per Unit | Price per Sqft | Rent per Unit | Days on Market | Low Price | High Price | order_column |
---|---|---|---|---|---|---|---|---|---|
Active | 276 | 1,352,790 | 252,199 | 323 | 1,217 | 121 | 140,000 | 21,570,000 | 1 |
Under Contract | 59 | 803,010 | 236,430 | 259 | 1,100 | 78 | 100,000 | 3,100,000 | 2 |
Coming Soon | 0 | 0 | 0 | 0 | 0 | 0 | 0 | 0 | 3 |
Sold as of 3.16.2025 | Listings | Avg Price | YoY | Price per Unit | Price per Sqft | Price per Unit | Rent per Unit | Sold Price to Orig List Price | Days on Market | Low Price | High Price |
---|---|---|---|---|---|---|---|---|---|---|---|
Last 3 mos | 108 | 694,818 | 0.0 | 215,818 | 288 | 1,293 | 95 | 92 | 68 | 160,000 | 2,750,000 |
Last 6 mos | 228 | 679,557 | 0.0 | 211,402 | 279 | 1,132 | 96 | 93 | 60 | 160,000 | 2,750,000 |
Last 12 mos | 422 | 709,909 | 0.0 | 206,942 | 275 | 1,129 | 95 | 92 | 60 | 55,000 | 5,250,000 |
2025 | 86 | 690,443 | -0.4 | 207,965 | 287 | 1,257 | 96 | 93 | 65 | 160,000 | 2,750,000 |
2024 | 397 | 749,850 | -1.1 | 208,700 | 277 | 1,104 | 96 | 93 | 64 | 55,000 | 5,600,000 |
2023 | 344 | 790,987 | -2.3 | 211,016 | 289 | 1,066 | 95 | 93 | 58 | 50,000 | 8,670,000 |
2022 | 552 | 812,251 | 30.3 | 215,919 | 907 | 986 | 97 | 95 | 37 | 100 | 9,250,000 |
2021 | 759 | 669,655 | 29.0 | 165,766 | 371 | 821 | 99 | 98 | 39 | 75,000 | 8,400,000 |
An In-Depth Look at Greater Phoenix Multifamily Dwellings
The multifamily market in Greater Phoenix, as of March 16, 2025, showcases a complex interplay of increasing inventory, decreasing average Days on Market (DOM), and rising sold prices. Currently, there are 334 active listings, a significant increase from 243 listings just three months ago. This rise in inventory suggests a greater selection for buyers, possibly creating a more competitive environment.
Notably, the average DOM for active listings has decreased to 121 days, down from 143 days three months ago. This trend indicates that while more options are available, properties are also selling faster, which can benefit both buyers, who may find appealing options, and sellers, who are seeing quicker sales.
In terms of pricing, the average sold price has climbed to $652,454 over the past month, reflecting an upward trend from $636,333 in the previous quarter. This upward movement in sold prices, alongside an increase in inventory and faster selling times, suggests a responsive market adjusting to changes in buyer demand and housing availability.
Analyzing months of inventory, the current 9.3 months indicated suggests a balanced market, typically signaling that neither buyers nor sellers hold a predominant advantage. This equilibrium offers strategic opportunities for both parties; buyers may leverage the increased inventory to negotiate better terms, while sellers can benefit from higher prices despite the growing selection.
Overall, the Greater Phoenix multifamily market is demonstrating flexibility and responsiveness, shaped by changing consumer preferences and economic factors. For prospective buyers and sellers, staying informed about these metrics will be crucial for making well-timed decisions in this evolving landscape.

Brian Adamski, Realtor
17+ Years of Experience
Honesty. Trustworthy. Integrity.
480-405-1265

Brian Adamski, Realtor
17+ Years of Experience
Honesty. Trustworthy. Integrity.
480-405-1265
