Mesa Market Overview
Highlights
As of April 22, 2025, the single family homes market in Mesa exhibits notable trends impacting both buyers and sellers.
- Active listings have experienced a significant rise, climbing to 1,634 over the past month from 1,243 three months ago.
- The average price per square foot for active listings is currently $287, a slight increase compared to earlier periods.
- Days on Market (DOM) have also lengthened, sitting at 68 days, indicating a more cautious buyer environment.
- With 4.7 months of inventory, the market appears to show signs of balance between supply and demand.
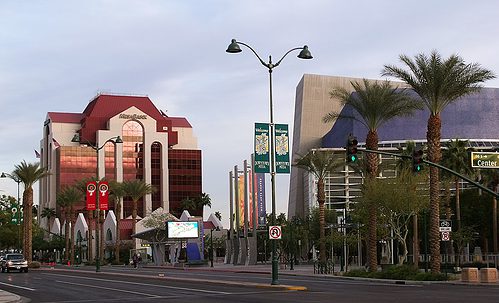
Info About Mesa
Mesa Homes for Sale
Mesa, Arizona, is the third-largest city in Arizona, with a population of just over 509,000 people. This bustling city is home to over 120 defined neighborhoods and possesses a diverse homes for sale covering many price points and types. Whether you are just starting out or downsizing and hope to invest in a modest home or you plan to invest millions in a luxury property, it’s here for you in Mesa.
It’s this abundance of housing options – along with a diverse economy — that attracts many young professionals to the area. Over 40 percent of Mesa residents are between 18 and 44 years old.
Read More...
And the character of Mesa reflects the youth and energy of its population. Great restaurants, popular nightspots, and trendy boutique retail outlets – as well as recognizable chain outlets – fill downtown Mesa and spread throughout the city. This makes it easy for friends to get together and socialize over dinner and drinks every night of the week.
Mesa’s Diverse Real Estate
The city of Mesa – due to its long east-to-west span – is commonly divided into East and West Mesa with Center Street being the accepted point where West Mesa becomes East Mesa.
Property values tend to increase as one moves out from the center of Mesa, with the most highly sought-after luxury properties typically found along the city’s outskirts.
Downtown Mesa
Entry-level and affordable housing options for those just starting out or choosing to downsize are found in the area south of the two college campuses in Mesa – the polytechnic branch of Arizona State University and Mesa Community College.
Working in Mesa
Mesa offers many career opportunities across various industries – both blue and white-collar. Banner Health Systems – a nonprofit healthcare provider — is Mesa’s largest employer employing over 8,000 people. The Mesa Public School System is the second-largest employer, and The Boeing Company rounds out the top three.
In addition to these large-scale employers, Mesa has a thriving economy built on various small businesses. Regardless of a person’s skill set, there are opportunities within Mesa.
What to do in Mesa
When it comes to filling the leisure hours, Mesa has plenty to offer. Surrounded by the Sonoran desert with the Superstition Mountains to the east, Mesa is the outdoor enthusiasts’ dream. Whether that involves hiking or riding through the mountains, tackling the desert in an ATV, exploring the Tonto National Forest, or cooling off at one of Mesa’s three recreational lakes, it’s all right here every day of the week.

Mesa Spring Training
Mesa’s cultural and artistic heart is Mesa Arts Center – Arizona’s largest art education center. The Mesa Arts Center is one of the nation’s leading artistic incubators, featuring five separate art galleries, a performing arts center, and a rotating series of installations. Mesa’s appreciation and support of the arts extend beyond just the Arts Center. Mesa’s Main Street is lined with no less than 40 permanent sculptures for everyone to enjoy.
Restaurants and nightspots abound within Mesa. Most are concentrated in the downtown area and around the two campuses along University Drive. Here, visitors and residents can find cuisine from every culture known for their culinary contributions – just another example of Mesa’s appreciation for ethnic diversity. In addition to the restaurants and bars around the downtown area, there are plenty of hidden gems scattered throughout the city.
Mesa Homes for Sale


Be the First to See New Listings
No pressure. Unsubscribe anytime. I hate spam too, so you can trust that I'll safeguard your information.
Mesa Market Report
An In-Depth Look at Mesa Houses
Currently, the Mesa single family homes market presents both opportunities and challenges for prospective buyers and sellers. Over the past month, the number of active listings surged to 1,634, a substantial increase from 1,243 listings three months ago. This uptick is indicative of growing supply in the market, allowing buyers a wider selection. However, with the average days on market (DOM) now at 68, compared to 91 days three months ago, there are signs that homes are taking longer to sell, which can reflect a more discerning buyer mindset.
Moreover, while the average price per square foot for active listings is steady at $287, it still marks an increase from previous periods, implying that sellers might still be benefitting from high demand despite longer selling timelines. The average sold price stands at $554,188 based on recent sales, suggesting some stabilization in pricing despite slight fluctuations.
Looking at the months of inventory, we see a current figure of 4.7, pointing towards a balanced market. This is up from 3.6 months just three months ago, indicating that while demand is robust, inventory levels are catching up, creating a healthier environment for negotiations.
In addition to these metrics, it is essential to consider the local economic context. Factors such as interest rates, consumer confidence, and local employment trends can fluctuate, affecting buyer behavior and overall market dynamics. Sellers may need to be more strategic with pricing and timing as inventory expands.
Overall, with the balance in inventory levels and a rise in the average days on market, there may be advantages for buyers to negotiate offers, while sellers should consider pricing strategies that reflect the current reality.

Brian Adamski, Realtor
Honest and Trustworthy
Skilled Negotiator

480-405-1265