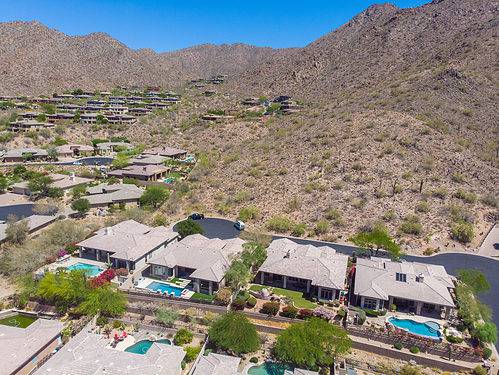
City of Phoenix
Real Estate
Brian Adamski, Realtor
Phoenix Resident Since 2003
Arizona’s Elite: Top 3% Realtor
Phoenix Market Overview
Highlights
As of April 14, 2025, the single-family home market in Phoenix shows some significant trends that highlight the dynamics of supply and demand.
- Active listings have surged to 3,790 over the past month, noticeably higher than the 2,704 recorded three months ago.
- The months of inventory now stands at 5.1, a notable increase from 3.5 months three months ago, indicating a softer market.
- Over the last month, the average sold price has dipped to $649,141, decreasing from $694,202 three months prior.
- As the Days on Market (DOM) currently averages 70 days, compared to 94 days three months ago, homes are selling relatively quicker now.
Market Snapshot as of 4.14.2025 | Inventory and Pricing |
---|---|
Active Listings: | 2,699 |
Avg Price: | $911,394 |
Avg Days on Market: | 69 |
Avg Price per Sqft: | $355 |
Months of Inventory: | 4.7 |
Sold Listings (last mo): | 997 |
Avg Price: | $658,665 |
Avg Days on Market: | 50 |
Avg Price per Sqft: | $321 |
Sold Listings (last 3 mos): | 2,548 |
Avg Price: | $656,826 |
Avg Days on Market: | 54 |
Avg Price per Sqft: | $316 |
Highlights
As of April 14, 2025, the condo/townhome/patio homes market in Phoenix reveals some interesting dynamics worth noting.
- Active listings have notably increased to 1,531 over the last month, substantially higher than the 1,105 recorded three months ago.
- Despite the growing inventory, the average sold price has risen to $397,312, which indicates sustained buyer interest.
- However, the Days on Market (DOM) average has also risen to 71 days, up from 62 just three months ago, signaling a slightly slower pace for sales.
Market Snapshot as of 4.14.2025 | Inventory and Pricing |
---|---|
Active Listings: | 1,244 |
Avg Price: | $411,233 |
Avg Days on Market: | 86 |
Avg Price per Sqft: | $306 |
Months of Inventory: | 6.8 |
Sold Listings (last mo): | 263 |
Avg Price: | $389,644 |
Avg Days on Market: | 73 |
Avg Price per Sqft: | $281 |
Sold Listings (last 3 mos): | 709 |
Avg Price: | $395,977 |
Avg Days on Market: | 72 |
Avg Price per Sqft: | $289 |
Highlights
As of April 14, 2025, the land market in Phoenix displays significant trends that highlight shifting dynamics.
- The current number of active listings has risen to 287 over the past month, a notable increase from 236 three months ago.
- Meanwhile, the months of inventory in the area suggest a slower turnover, increasing to 25.3 months, up from 16.1 months just three months prior.
- Additionally, the average sold price has surged to $885,438 compared to the $564,947 seen three months ago, indicating strong buyer interest despite lengthy market times.
Market Snapshot as of 4.14.2025 | Inventory and Pricing |
---|---|
Active Listings: | 272 |
Avg Price: | $841,755 |
Avg Days on Market: | 213 |
Avg Price per Sqft: | $24 |
Months of Inventory: | 23.9 |
Sold Listings (last mo): | 9 |
Avg Price: | $773,322 |
Avg Days on Market: | 87 |
Avg Price per Sqft: | $29 |
Sold Listings (last 3 mos): | 37 |
Avg Price: | $585,264 |
Avg Days on Market: | 143 |
Avg Price per Sqft: | $18 |
Highlights
As of April 14, 2025, the multifamily market in Phoenix is showcasing notable shifts in key metrics, primarily driven by rising inventory levels and changes in pricing dynamics.
- Over the past month, active listings have increased to 204, which is a significant rise from 157 three months ago, indicating a growing supply in the market.
- The average sold price for the last 30 days is $807,616, reflecting a considerable increase compared to $660,657 just three months ago.
- Days on Market (DOM) for sold listings have tapered down to 57 days, a reduction indicative of a more competitive environment despite increasing inventory.
- The months of inventory have risen to 10.2, highlighting a shift towards a buyers' market, as the supply has outpaced sales activity.
Market Snapshot as of 4.14.2025 | Inventory and Pricing |
---|---|
Active Listings: | 179 |
Avg Price: | $1,326,500 |
Avg Days on Market: | 104 |
Avg Price per Sqft: | $316 |
Months of Inventory: | 10.2 |
Sold Listings (last mo): | 19 |
Avg Price: | $793,100 |
Avg Days on Market: | 41 |
Avg Price per Sqft: | $249 |
Sold Listings (last 3 mos): | 61 |
Avg Price: | $718,241 |
Avg Days on Market: | 60 |
Avg Price per Sqft: | $256 |
Info About Phoenix
Did You Know?
Phoenix is the capital of Arizona and is located within Maricopa county. The City of Phoenix is the 5th largest in the United States (1.7 million people). Geographically larger than Los Angeles, the city spans more than 500 square miles.
Everybody’s Moving to Phoenix!
Ok, maybe not everybody, but according to recent reports and data, the demand for Phoenix real estate has been on the rise in recent years.
Several factors contribute to the increasing demand, including a growing population, favorable economic conditions, and affordable housing prices compared to other major metropolitan areas.
Read More......Read Less
Additionally, the COVID-19 pandemic has caused a shift in housing demand, with many people moving away from densely populated urban areas to suburban and more affordable areas like Phoenix. This trend has further fueled the demand for real estate in the region.
Not Just Some Western Town
If you want to learn more about the history, artifacts, and art of the people of the Southwest (Native American and Hispanic cultures), then the Heard Museum is for you.
The Phoenix Art Museum has more modern art as well as hosting both international and national exhibits.
Don’t miss the Dorrance Planetarium at the Science Center.
The Phoenix Zoo is one of America’s most successful, privately-owned, and nonprofit zoos. It was voted one of the top five zoos for kids. And sitting right next to the Phoenix Zoo is the magnificent Desert Botanical Garden.
North Phoenix is host to the Musical Instrument Museum (MIM), which displays modern and historical instruments from around the world and collectibles from musical superstars such as John Lennon. There is also a theatre there to enjoy a concert from world-renowned groups and individuals. The Experience area allows you to play instruments from around the world.
There is the Phoenix Symphony and Ballet Arizona which are sure to please even the most refined palates.
Catch the Phoenix Diamondbacks play baseball, the Phoenix Coyotes play hockey, the Phoenix Cardinals play football, or the Phoenix Suns play basketball.
Navigating the Phoenix Real Estate Market
The City of Phoenix is home to a wide variety of houses. There are high-rise buildings in downtown Phoenix, historic districts, older, well-established neighborhoods, newer homes inserted into existing neighborhoods through infill projects, stunning neighborhoods of luxury homes that range in age from older to newer, and traditional tract home neighborhoods in the suburbs. Everyone can find something.
The Phoenix real estate market is vast and it takes a veteran Phoenix Realtor to help you. Brian knows Phoenix well and that is reflected in the fact that he is ranked in the top 3% in Arizona.
Featured Neighborhoods within the City of Phoenix
NOTE: The City of Phoenix is divided into many different neighborhoods, but I haven't had time to add them all here yet. I have worked in each one, so I am familiar with them all.
Phoenix Homes for Sale
Be the First to See New Listings
No pressure. Unsubscribe anytime. I hate spam too, so you can trust that I'll safeguard your information.
Phoenix Market Report
Current as of 4.14.2025 | Listings | Avg Price | Price per Sqft | Days on Market | Low Price | High Price | order_column |
---|---|---|---|---|---|---|---|
Active | 2,699 | 911,394 | 355 | 69 | 1 | 30,000,000 | 1 |
Under Contract | 1,341 | 637,534 | 308 | 64 | 135,000 | 7,000,000 | 2 |
Coming Soon | 153 | 881,019 | 366 | 0 | 265,000 | 6,800,000 | 3 |
Sold as of 4.14.2025 | Listings | Avg Price | YoY | Price per Sqft | Days on Market | Sold Price to List Price | Sold Price to Orig List Price | Low Price | High Price |
---|---|---|---|---|---|---|---|---|---|
Last 3 mos | 2,548 | 656,826 | 0.0 | 316 | 53 | 98 | 95 | 125,000 | 10,650,000 |
Last 6 mos | 4,797 | 655,211 | 0.0 | 313 | 51 | 98 | 95 | 125,000 | 14,000,000 |
Last 12 mos | 9,925 | 642,875 | 0.0 | 310 | 47 | 98 | 96 | 95,000 | 14,000,000 |
2025 | 2,741 | 655,243 | 3.0 | 317 | 53 | 98 | 96 | 125,000 | 10,650,000 |
2024 | 9,916 | 636,165 | 8.5 | 308 | 45 | 98 | 96 | 70,000 | 14,000,000 |
2023 | 10,132 | 586,289 | 1.5 | 294 | 47 | 98 | 96 | 90,000 | 7,000,000 |
2022 | 13,360 | 577,612 | 16.3 | 310 | 29 | 100 | 98 | 60,000 | 7,800,000 |
2021 | 17,986 | 496,635 | 23.7 | 254 | 21 | 101 | 101 | 90,000 | 6,000,000 |
An In-Depth Look at Phoenix Houses
The single-family home market in Phoenix, as of April 14, 2025, continues to reflect evolving trends shaped by varying inventory levels and pricing shifts.
Starting with inventory dynamics, the number of active listings has climbed significantly to 3,790 over the past month, compared to only 2,704 three months ago, indicating a strong influx of properties. This surge contributes to a months of inventory level of 5.1, which signals a market trending toward buyer's favor as it is above the typical balanced range of 4 to 6 months. The extended months of inventory, generally suggesting ample choices for buyers, can exert downward pressure on prices as sellers compete for attention.
The average sold price has seen a decline to $649,141, down from $694,202 three months ago, representing a shift in buyer appetite or market conditions. This is coupled with a price per square foot for sold listings that remains stable at $314, closely reflecting previous price trends but showing signs of potential adjustments as sellers navigate the current competition.
Interestingly, despite the increase in listings, the Days on Market (DOM) has improved sharply from 94 days to 70 days. This reflects a slight resurgence in buyer activity, suggesting that properties are moving faster now even amidst a broader increase in supply. This decline in DOM could indicate buyer confidence returning as properties, although cost-sensitive, are being recognized for their value.
Considering these metrics holistically, the Phoenix housing market presents a landscape characterized by a growing inventory and fluctuating pricing strategies, compelling buyers to act as opportunities arise while sellers need to remain attentive to the evolving expectations of their list prices. In conclusion, for both buyers and sellers, understanding these trends will be instrumental in navigating the current market effectively, ensuring informed decisions that align with the prevailing economic conditions and buyer sentiment.
Current as of 4.14.2025 | Listings | Avg Price | Price per Sqft | Days on Market | Low Price | High Price | order_column |
---|---|---|---|---|---|---|---|
Active | 1,244 | 411,233 | 306 | 86 | 1 | 4,400,000 | 1 |
Under Contract | 374 | 423,625 | 307 | 79 | 75,000 | 2,550,000 | 2 |
Coming Soon | 33 | 430,797 | 316 | 0 | 125,000 | 1,399,000 | 3 |
Sold as of 4.14.2025 | Listings | Avg Price | YoY | Price per Sqft | Days on Market | Sold Price to List Price | Sold Price to Orig List Price | Low Price | High Price |
---|---|---|---|---|---|---|---|---|---|
Last 3 mos | 709 | 395,976 | 0.0 | 289 | 72 | 97 | 94 | 60,000 | 2,500,000 |
Last 6 mos | 1,310 | 383,550 | 0.0 | 342 | 68 | 97 | 94 | 59,000 | 2,500,000 |
Last 12 mos | 2,801 | 373,220 | 0.0 | 317 | 60 | 97 | 94 | 59,000 | 4,500,000 |
2025 | 774 | 391,161 | 5.9 | 289 | 72 | 97 | 94 | 60,000 | 2,500,000 |
2024 | 2,818 | 369,242 | 7.2 | 319 | 55 | 98 | 95 | 59,000 | 4,500,000 |
2023 | 3,065 | 344,556 | -1.1 | 282 | 46 | 98 | 96 | 48,000 | 4,250,000 |
2022 | 4,084 | 348,387 | 18.1 | 285 | 25 | 100 | 99 | 65,000 | 6,000,000 |
2021 | 5,751 | 295,012 | 23.9 | 237 | 24 | 101 | 100 | 37,000 | 3,725,000 |
An In-Depth Look at Phoenix Condos
The current landscape of the Phoenix condo/townhome/patio homes market is complex and multifaceted. Currently, there are 1,531 active listings, representing a significant increase from the 1,105 active listings reported three months ago, showcasing a 39% rise in options for potential buyers. This influx of listings translates to a months of inventory at 7.0, which is indicative of a buyer's market, as a historic threshold is typically below 4 for favoring sellers.
Meanwhile, the competition amongst buyers remains resilient, as indicated by the average sold price of $397,312 over the past month, up from $356,155 just three months prior. This increase of approximately 11.5% displays a continued confidence in market dynamics, even as more listings become available. Interestingly, however, the average DOM has now reached 71 days, up from 62 days, pointing to a gradual cooling in sales velocity. This trend suggests that while buyers are willing to engage at higher price points, they may be exercising more caution and putting a premium on choosing the right fit, leading to more extended periods of deliberation before closing.
Examining some historical context, 12 months ago, there were only 267 sold listings, and the average sold price was notably lower at $352,121. This increase in sold prices amidst rising inventory could indicate not only an uptick in demand but also a shift in buyer expectations regarding value, quality, and homes' offerings.
The price per square foot for sold homes also illustrates a robust trend: currently at $292, up from $279 three months ago. This uptick, paralleling the increase in active inventory, suggests that despite the growing options available to buyers, prices for desirable properties are gaining traction, reflective of ongoing buyer confidence.
From a strategic standpoint, the current market conditions may suggest that potential buyers should act sooner rather than later. Despite increasing inventory, significant price growth signals that homes presently on the market may become even pricier as demand continues to outpace supply in certain segments. For sellers, while now may present opportunities for more competitive pricing strategies, patience could yield better outcomes as buyers still seem willing to pay more than previous averages, provided they find the right home.
Current as of 4.14.2025 | Listings | Avg Price | Price per Acre | Price per Sqft | Days on Market | Low Price | High Price | order_column |
---|---|---|---|---|---|---|---|---|
Active | 272 | 841,755 | 1,042,302 | 24 | 213 | 1 | 30,000,000 | 1 |
Under Contract | 33 | 1,314,531 | 762,078 | 17 | 338 | 80,000 | 7,500,000 | 2 |
Coming Soon | 0 | 0 | 0 | 0 | 0 | 0 | 0 | 3 |
Sold as of 4.14.2025 | Listings | Average Price | YoY | Price per Sqft | Price per Acre | Days on Market | Sold Price to List Price | Sold Price to Orig List Price | Low Price | High Price |
---|---|---|---|---|---|---|---|---|---|---|
Last 3 mos | 37 | 585,264.0 | 0.0 | 17 | 767,139 | 142 | 90 | 84 | 15,000 | 4,500,000 |
Last 6 mos | 82 | 574,659.0 | 0.0 | 19 | 831,172 | 143 | 90 | 85 | 6,500 | 4,500,000 |
Last 12 mos | 176 | 487,037.4 | 0.0 | 17 | 761,174 | 134 | 91 | 86 | 6,382 | 4,500,000 |
2025 | 37 | 579,427.0 | 2.4 | 18 | 772,483 | 153 | 90 | 84 | 15,000 | 4,500,000 |
2024 | 207 | 407,554.0 | 4.5 | 17 | 754,148 | 154 | 93 | 88 | 5,000 | 3,250,000 |
2023 | 216 | 358,948.0 | -4.2 | 17 | 721,367 | 136 | 91 | 88 | 8,000 | 5,200,000 |
2022 | 257 | 402,091.0 | 44.1 | 17 | 753,294 | 105 | 96 | 93 | 1,265 | 4,750,000 |
2021 | 390 | 378,200.0 | 18.8 | 12 | 522,903 | 141 | 95 | 93 | 17,000 | 5,400,000 |
An In-Depth Look at Phoenix Land
The land market in Phoenix, as of April 14, 2025, reveals critical shifts that emphasize both the opportunities and challenges currently faced by buyers and sellers. Over the past month, the number of active listings increased significantly to 287 from 236 three months earlier, reflecting a more ample supply of land. This uptick in inventory is complemented by a dramatic rise in months of inventory, which now stands at 25.3 months—a rise from 16.1 months three months ago, indicating a slower absorption rate of available properties.
The average days on market (DOM) currently rests at 219 days, up from 259 days three months ago. This extended period suggests that buyers are facing a more deliberate decision-making process, as they have a wider selection of properties to consider. However, the average sold price tells a different story of demand, climbing sharply to $885,438 over the past month, compared to $564,947 just three months ago. This marked increase in sold prices could imply that despite longer market times, buyers may still be willing to invest significantly in properties that meet their criteria.
Moreover, comparing the average price per square foot for sold listings, which is currently at $17, shows an increment compared to prior data, suggesting slight upward pressure on pricing despite the increase in inventory levels. Additionally, the sold price-to-original list price ratio has decreased to 80%, down from 86% three months ago, reflecting a potential shift towards buyer negotiation power following prolonged market exposure of listings.
Given these trends, sellers in Phoenix may need to adopt a strategic approach, possibly adjusting pricing or improving property presentation to expedite sales given the extended DOM and rising inventory. For buyers, the current landscape offers a unique opportunity to negotiate on price, especially as new listings continue to come onto the market readily. Understanding these dynamics will be crucial for anyone looking to navigate the Phoenix land market effectively.
Current as of 4.14.2025 | Listings | Avg Price | Price per Unit | Price per Sqft | Rent per Unit | Days on Market | Low Price | High Price | order_column |
---|---|---|---|---|---|---|---|---|---|
Active | 179 | 1,326,500 | 238,450 | 316 | 1,223 | 104 | 159,900 | 19,080,000 | 1 |
Under Contract | 40 | 691,233 | 197,310 | 265 | 1,031 | 106 | 200,000 | 1,750,000 | 2 |
Coming Soon | 2 | 542,500 | 215,000 | 298 | 1,241 | 0 | 450,000 | 635,000 | 3 |
Sold as of 4.14.2025 | Listings | Avg Price | YoY | Price per Unit | Price per Sqft | Price per Unit | Rent per Unit | Sold Price to Orig List Price | Days on Market | Low Price | High Price |
---|---|---|---|---|---|---|---|---|---|---|---|
Last 3 mos | 61 | 718,240 | 0.0 | 211,819 | 256 | 1,444 | 94 | 90 | 60 | 279,900 | 2,900,000 |
Last 6 mos | 132 | 721,799 | 0.0 | 201,953 | 281 | 1,229 | 95 | 91 | 68 | 279,900 | 2,900,000 |
Last 12 mos | 244 | 740,259 | 0.0 | 203,241 | 287 | 1,188 | 95 | 92 | 60 | 150,000 | 5,250,000 |
2025 | 65 | 747,875 | -0.1 | 204,648 | 274 | 1,357 | 95 | 91 | 61 | 279,900 | 2,900,000 |
2024 | 241 | 793,423 | -6.9 | 204,859 | 292 | 1,116 | 96 | 93 | 64 | 150,000 | 5,600,000 |
2023 | 209 | 790,857 | -1.7 | 219,935 | 306 | 1,079 | 96 | 93 | 56 | 160,000 | 4,800,000 |
2022 | 288 | 805,888 | 31.4 | 223,790 | 1,519 | 978 | 98 | 96 | 39 | 138,000 | 5,115,000 |
2021 | 417 | 691,715 | 29.4 | 170,337 | 228 | 864 | 98 | 97 | 42 | 182,500 | 8,300,000 |
An In-Depth Look at Phoenix Multifamily Dwellings
In the detailed analysis of the multifamily market in Phoenix, we observe a combination of factors pointing to changing market dynamics as of April 14, 2025.
Starting with inventory levels, we've seen a noticeable uptick in active listings, with 204 available over the past month. This number represents an increase from 157 listings three months ago and 125 six months ago. Such an influx suggests that sellers are motivated to enter the market, possibly due to rising demand or favorable selling conditions. However, with the increasing inventory comes a current months of inventory reading of 10.2, which historically indicates more options for buyers, thus creating a less frantic pace compared to previous periods.
Turning to sold prices, the average has crossed the $800,000 mark, specifically landing at $807,616 in the last 30 days. This increase contrasts with the average of $660,657 from three months ago, highlighting a strong appreciation in property values despite the overall high inventory. It's particularly interesting to note that despite some volatility in the market, the sold price is significantly better than $660,657, reflecting a lag in previous price adjustments aligned with current market conditions.
The Days on Market (DOM) also provides a critical lens through which to view these developments. Currently, properties are selling at an average of 57 days, which indicates a quicker turnover than the 105 days seen when comparing to three months ago. This reduction in DOM can suggest that buyer confidence is rising, even in a market that is resulting in heavy inventories, which might seem counterintuitive at first glance.
Economic factors considering buyer behavior, interest rates, and consumer sentiment could illuminate this change further. For example, if interest rates remain stable or decrease, a larger pool of qualified buyers may be contributing to faster sales despite the growing inventory. The market activity, including the sold price to original list price percentage, averaged 93% over the past month, which suggests that sellers might be negotiating more actively to close deals.
In conclusion, the multifamily sector in Phoenix is currently navigating through increased inventory levels, appreciating sale prices, and a faster pace of sales. Buyers might find more options available, while sellers may need to adapt to these changing market conditions, potentially adjusting their pricing strategies for optimal outcomes. Buyers looking to capitalize on this balanced market may benefit from the selections available, while sellers need to be astute about pricing given the broadening inventory.

Brian Adamski, Realtor
Phoenix Resident Since 2003
Arizona’s Elite: Top 3% Realtor
480-405-1265

Brian Adamski, Realtor
Phoenix Resident Since 2003
Arizona’s Elite: Top 3% Realtor
480-405-1265
